Marin County Real Estate Market Report
January 2026

View from 33 DeSilva Island Drive in Mill Valley Which I Sold Off-Market in December
(Photo Courtesy of E. Lam)
January 2026 Marin Real Estate Market Report: 4 Key Takeaways
-
Median Price Down: The year ended with a median sold price of $1,215,000, a 4.7% decrease compared to last year, reflecting a seasonal cooling and a shift in buyer leverage.
-
Critically Low Supply: Inventory remains exceptionally tight with only 197 homes for sale and 1.3 months of supply (both down over 7% year-over-year), which prevents a deeper price drop.
-
Slower Market Velocity: The seasonal pace shift is evident in the “marketing time,” with average Days on Market rising to 68—a significant 21.4% increase in how long it takes to sell.
-
Strategic Opportunity: Despite slower sales, well-positioned properties in high-demand areas like Larkspur, San Rafael and Mill Valley are still attracting strong offers due to the persistent lack of inventory.
Happy New Year, and welcome to my first Marin County market report of 2026. December closed with a median sold price of $1,215,000 (down 4.7% year-over-year), 197 homes for sale (down 7.1% year-over-year), and 1.3 months of inventory (down 7.3% year-over-year). At the same time, the seasonal pace shift showed up clearly in marketing time: average days on market rose to 68 (up 21.4% year-over-year), even as supply remained relatively tight.
As we close out 2025 and move into the heart of the winter season, Marin’s market is doing what it typically does this time of year: fewer transactions begin, but well-positioned homes still sell, and the market rewards preparation and correct pricing. December’s numbers show a slower, more selective pace than the spring and early fall, with longer marketing times and a modest year-over-year dip in the median — alongside relatively tight supply.
Key Year-Over-Year Metrics for Marin County (December 2025 vs. December 2024)
- Median sold price: $1,215,000 (down 4.7% YoY)
- Homes for sale: 197 (down 7.1% YoY)
- Closed sales: 149 (down 3.2% YoY)
- Pending sales: 102 (up 21.4% YoY)
- Average days on market: 68 (up 21.4% YoY)
- Months of inventory: 1.3 (down 7.3% YoY)
- Average sold price per square foot: $819 (down 2.3% YoY)
- Sale price to original list price: 93% (vs. 95% last December)
What This Means for Pricing Power
The headline number this month is the year-over-year dip in the median sold price (down 4.7%). On its own, that can look more dramatic than it is, because December is a smaller, more seasonal sample and the median can move meaningfully based on which price tiers happened to close. The sale price to original list price ratio also softened (93% vs. 95% last year), which reinforces the broader theme we’ve been seeing in a more balanced market: buyers are more price-sensitive and condition-conscious, and homes that feel even slightly “off” on value or presentation tend to sit longer and invite negotiation.
At the same time, supply remains relatively constrained (1.3 months of inventory), which is an important counterbalance. The takeaway: pricing power still exists — but it’s increasingly “earned” through strong strategy, preparation, and precise positioning rather than assumed.
Supply and Demand Heading Into Year-End
Inventory is actually lower than last year (197 homes for sale, down 7.1%), and months of inventory is also lower (1.3 vs. 1.4). Yet market time increased materially (68 days on market vs. 56). That combination is worth noting because it suggests that the pace of demand has slowed seasonally and buyers are taking longer to commit — even though the overall supply picture is not flooding the market.
One encouraging signal is pendings: pending sales were up 21.4% year-over-year, which can be an early indicator that activity may be stabilizing as we move into the first quarter.
This Month’s Headlines
The Federal Reserve cut its key interest rate by 0.25%, bringing the target range to 3.5%–3.75%, and signaled a more complicated path ahead for additional cuts (with a 9–3 vote).
• Bay Area venture capital funding remained exceptionally strong in 2025, with more than $140B deployed through November — nearly 60% of all U.S. VC funding — largely concentrated in artificial intelligence (per the Bay Area report excerpt you provided).
• The Bay Area report also underscored how “well-located and well-priced” homes continue to sell quickly, often over asking, even as the broader region moves toward a more balanced supply/demand environment.
• Wells Fargo noted that new home sales picked up in September and October alongside slightly lower mortgage rates and increased builder incentives, but that at the national level new home inventory remains elevated (7.9 months of supply at October’s sales pace).
• Wells Fargo also reported that incentives are rising: 40% of builders reported cutting prices in December, and 67% used sales incentives — with the national median new home price down 8.0% year-over-year in October to $392.3K.
Greater Bay Area Context
This month’s Sotheby’s annual market report is a helpful reminder that the longer-term trend line looks steadier than any single month. The report notes that across the SF Bay Area, the median sales price remained stable in 2025, sales volume increased, and inventory continued to rise, creating “more balanced conditions” compared to the extremely tight years immediately prior.
For Marin specifically, the annual report indicates the median sales price remained stable at $1.7 million in 2025 and that sales volume increased by more than 5% year-over-year. It also highlights that the luxury segment remains an area of relative strength. In that context, December’s softer median reading locally is best interpreted as a seasonal, mix-driven month inside a market that has generally been normalizing — not a definitive signal of broad value erosion.
Nationally, the Wells Fargo update adds another layer: while slightly lower rates and incentives have supported new home demand, elevated inventory and widespread builder concessions suggest affordability remains the central issue. Even though Marin is not a new-construction-driven market, these national dynamics still matter because they influence consumer confidence, rates, and buyer psychology.
In My World
I am working with several clients on preparing their homes for sale in 2026, but I don’t have anything to announce quite yet. I did recently bring an off-market home in Mill Valley into escrow for one of my seller clients — a great example of why, in certain situations, an off-market strategy can be the best path.
When privacy, timing, or control of the process is a priority, off-market exposure can reduce disruption while still creating real competition — especially when it’s executed through the right channels. Through my participation in Top Agent Network, I can quietly present a home to a highly vetted group of top-performing agents and qualified buyers across Marin, San Francisco, and the greater Bay Area.
It’s also never too soon to begin planning for the spring market. The homes that perform best in March, April, and May are typically the ones where strategy starts months in advance — deciding whether to go on-market or off-market, identifying the highest-impact improvements, and aligning timing with broader market conditions.
Looking Forward to 2026
As we look ahead, I’m optimistic about 2026 — not because the market will be “easy,” but because clarity and good strategy matter more than ever, and that creates opportunity. If mortgage rates continue to ease and the Bay Area’s economic engine remains strong (particularly in AI and related tech), we may see more buyers come off the sidelines — especially in the entry and mid-price ranges where monthly payments drive decisions.
On a personal note, thank you for your trust and support — and for helping make 2025 another top year for me in Marin County with Golden Gate Sotheby’s International Realty. I don’t take that confidence for granted, and I’m looking forward to continuing to serve you, your friends, and your family in 2026.
How Can I Help?
Marin County continues to offer a compelling combination of lifestyle, location, and long-term value. I’m always happy to talk about the Marin County real estate market. Call or text me at 415-847-5584 for a personalized report for your home and neighborhood, or to discuss the best strategy for making your dream home a reality. Check out my newly-updated guides, Buying a home in Marin and Selling a Home in Marin. If this is all new to you, check out my newest guide for first time home buyers in Marin County.
Now Available!

Exclusively Offered for $4,895,000
Swipe to See More Homes


Check Out My Sizzle Reel!
From the Golden Gate Sotheby’s Bay Area Market Report…
An Active Year
The surge of investment in artificial intelligence and stronger return to office push by firms in San Francisco was the main driver of the Bay Area housing market this past year. Overall, the market moved closer to equilibrium between buyers and sellers. Elevated mortgage rates relative to the last decade dampened affordability for buyers, particularly in the lower and middle price tiers. However, the slight decrease in mortgage rates in the second half of the year did open some opportunities for buyers to offset affordability concerns. Meanwhile, stock market gains, renewed merger and acquisition activity, and greater availability of homes for sale also resulted in more purchase activity in the upper price segment.
The Impact Of Jobs On The Market
The Bay Area housing market was also very resilient despite a lackluster economy. Total jobs decreased earlier in 2025 before stabilizing towards the end of the year. The professional and business services and technology industries continued to shed jobs in 2025. The educational and health services sector added jobs at a rapid clip, with payrolls expanding by more than 3%. After increasing for much of the year, the unemployment rate stabilized in the latter half of 2025, and remained lower than the long-term average. The relatively tight labor market supported above-average wage growth as well, which along with lower mortgage rates bolstered housing affordability in the latter half of 2025. In a final positive note, the large outmigration from the Bay Area slowed further in 2025.
Surge In Supply Helps To Meet Buyer Demand
A defining feature of the 2025 housing market was the increase in homes available for sale. Average monthly listings increased by 27% in 2025 to the highest level since 2019. After a strong spring buying season, listings tapered to a seasonal low but remained greater than the prior year. Strong sales activity throughout the year in San Francisco resulted in a very tight market, with the fewest available homes for sale of any county in the region.
Sales Activity Increased In 2025
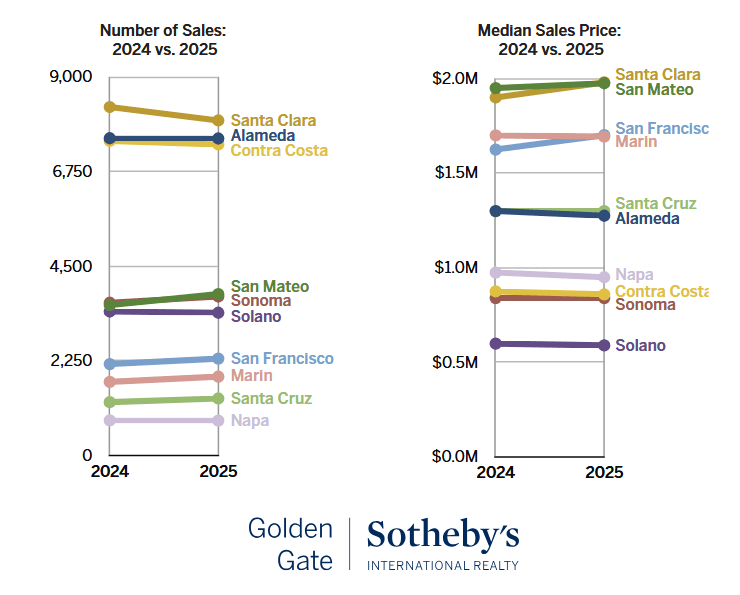
Sales activity increased in 2025 with a greater number of options available to buyers, and strong buyer demand for homes in and around San Francisco. More than 40,000 homes sold in 2025, nearly 1% more than the previous year and the highest annual total since 2022. The largest increases were in Marin, San Francisco and San Mateo counties, with sales up by more than 5% in each county. In Marin and San Mateo counties, the increased activity was greatest in cities closest to San Francisco. In San Francisco proper, the greatest number of homes sold since 2022. The number of closed sales also increased by more than 4% in Santa Cruz and Sonoma counties. Finally, there were fewer sales than the previous year in Alameda, Contra Costa and Solano counties.
An Increase In Sales At The Top And Bottom
In addition to the strong demand for homes closer to San Francisco, the number of sales increased at both ends of the price spectrum. Sales were more stable for homes priced between $750,000 and $2.5 million, reflecting the low affordability. Approximately 6,400 homes sold for more than $2.5 million in 2025, the greatest number since the post-pandemic surge in 2021 and double the number of sales in the years prior to 2020. More than 1,000 homes sold for $5 million, the highest number in nearly a decade. Santa Clara County accounted for more than one-third of sales of more than $2.5 million, as well as a large share of the increase, while sales in this segment increased by 22% year-over-year in San Francisco. More homes also sold in the lowest price segment, less than $750,000, across much of the Bay Area and specifically in the outer East Bay.
A More Balanced Market
The market moved closer to equilibrium and average days on market increased while the share of homes that sold for more than the list price decreased. Homes that sold in 2025 were on the market for 33 days on average, slightly more than the previous year, and less than half were sold for more than the asking price compared with 56% in 2024. The notable exception was the inner Bay Area, where strong buyer demand resulted in homes selling relatively quickly and a large share of homes selling for more than the listing price. Homes sold in less than four weeks in the inner Bay Area on average, with homes selling in less than three weeks in Santa Clara County. Notably, more than three-quarters of homes sold in San Francisco were sold above asking, with these sellers receiving 19% more than the list price, on average. The North Bay counties were generally weaker for these metrics, but still close to historical levels.
Pricing Changes Vary By Region
The Bay Area median single family sales price was relatively stable in 2025, but there was significant bifurcation among counties. The median sales price was $1.3 million in the Bay Area in 2025, 1% less than in 2024. However, the median sales price increased by 4.7% in San Francisco to $1.7 million. The median price also increased in San Mateo and Santa Clara counties to more than $1.9 million, while the price was stable in Marin County at $1.7 million. Conversely, the median sales price in Contra Costa, Napa and Solano counties declined by more than 1%. The price also declined in Alameda, but this may have been the result of the type of homes that sold, specifically a surge in sales of less than $750,000.
Looking Ahead
The Bay Area housing market was resilient in 2025 despite economic headwinds, which further reinforced the strength and depth of demand for housing. Looking ahead to 2026, there are significant tailwinds for the market as well as some persistent headwinds. The longer-term interest rates that underpin residential mortgage rates are expected to remain elevated, and could increase slightly. As a result, mortgage rates may remain stable or increase and keep some buyers sidelined for affordability reasons. However, IPO and M&A activity is expected to increase in 2026, which could bolster buyer activity particularly in the South Bay and Peninsula. Finally, the expansion of the AI industry continues to gain momentum and draw highly paid workers to the Bay Area, which could support wage growth and add to the deep pool of housing demand in the Bay Area.
What My Clients Are Saying…
Marin Real Estate Market Stats


Marin County Real Estate Market Report Charts
(click any slide to enlarge & launch slideshow)
“For Sale” vs. Sold Home Prices vs. Median Home Prices

Marin Home Prices List Price vs. Sold

Marin County Months of Inventory Based on Closed Sales

Average Price Per Square Foot

Marin County Number of Homes on the Market

I hope you have found my Marin County Real Estate Market Report informative. Please feel free to add your comments, questions or suggestions in the comments section below. If I may be of any assistance in helping you attain your real estate goals, please call or text me at 415-847-5584 and I will be in touch right away.
Would you like to see this data for your town only?
I am also excited to announce that my website now has new real estate market reports by town with more coming soon. Please check these out:
Belvedere Real Estate Market Report
Corte Madera Real Estate Market Report
Fairfax Real Estate Market Report
Kentfield Real Estate Market Report
Larkspur Real Estate Market Report
Mill Valley Real Estate Market Report
Novato Real Estate Market Report
San Anselmo Real Estate Market Report
San Rafael Real Estate Market Report
Tiburon Real Estate Market Report
These are all accessible from the “Market Reports” menu item here on my website at any time.

About the Author
Thomas Henthorne is consistently top-ranked, award-winning real estate agent in Marin, helping people buy and sell homes for almost a decade. He writes the #1 real estate blog in Marin County and is a frequent speaker on panels at industry gatherings.
He may be reached at 415-847-5584.
Marin County Real Estate Markets Covered in This Report: Belvedere | Corte Madera | Fairfax | Greenbrae | Kentfield | Larkspur | Mill Valley | Novato | Ross | San Anselmo | San Rafael | Sausalito | Stinson Beach | Tiburon


Leave a Comment
What do you think?Please leave your comment below!