Marin County Real Estate Market Report
December 2025
This market report remains on my website for archival purposes. See my current market report here.

As we head into December and the heart of the holiday season, Marin’s market is doing what it typically does this time of year: fewer new transactions begin, but well-positioned homes still sell, and the underlying fundamentals remain intact. The story in November is that pricing continues to hold even as inventories increase. This is a market that looks more balanced than the last few years, with buyers being selective and sellers needing to be sharper on preparation and positioning.
Key year-over-year metrics for Marin County (November 2025 vs. November 2024)
Median sold price: $1,380,000 (down 0.4% YoY — essentially flat)
Homes for sale: 394 (up 10.1% YoY)
Average days on market: 47 (down 7.8% YoY)
Months of inventory: 2.1 (flat YoY)
Average sold price per square foot: $845 (down 6.5% YoY)
Sale price to original list price: 96% (flat YoY)
What this means for pricing power
The median sold price is essentially holding steady year-over-year, which is an important signal going into 2026. At the same time, the average sale price per square foot is lower than last year, suggesting buyers are negotiating more, property condition is mattering more, and the market is less forgiving of homes that feel overpriced or under-prepared. The sale-to-original-list-price ratio holding at 96% reinforces that point: pricing power remains intact for the homes that are positioned correctly, but buyers are not broadly paying above list on average.
Supply and demand heading into year-end
Inventory is up year-over-year, giving buyers more choice than they had last fall. Even with that increase, months of inventory remains at 2.1—flat from last year—which indicates the market is not building excess supply. In practical terms, this is a healthier environment: buyers can be more thoughtful, and sellers can still succeed with strong presentation, accurate pricing, and a clear marketing plan.
This Month’s Headlines
- The Federal Reserve cut its key interest rate by 0.25%, setting the target range at 3.5%–3.75%, while signaling a more challenging path ahead for further reductions; the decision included three dissents.
• Mortgage rates have eased in recent months, and even small shifts continue to matter for payment-sensitive buyers—especially in the entry and mid-price segments.
• Venture capital investment in the SF Bay Area remains exceptionally strong, with more than $140 billion deployed year-to-date—nearly 60% of all U.S. VC funding—largely concentrated in artificial intelligence.
• AI-related hiring and wage growth continue to support Bay Area demand, particularly in San Francisco and Silicon Valley, with Marin often feeling that momentum shortly after.
• Regionally, inventory increased across most counties, though supply remains limited compared with historical norms in many areas.
• San Francisco stands out for intensity: the Bay Area report notes homes selling in roughly three weeks on average there, with more than 80% closing over asking, highlighting how location and pricing drive velocity.
Greater Bay Area Context
The Bay Area market is showing seasonal softness, but the economic base—especially venture funding and wage growth—remains a meaningful tailwind. The regional report describes a market that is increasingly bifurcated by county and price point. Inventory is higher across much of the region, yet still constrained relative to historical averages. Sales volume is slightly lower overall, but North Bay activity has been stronger in certain price tiers, helped by lower mortgage rates over recent months.
The report also emphasizes that where prices are down, the decline is often influenced by a larger share of lower-priced homes closing rather than a widespread drop in values. That theme aligns with what we’re seeing locally in Marin: a more normalized market where the outcome depends heavily on preparation, pricing, and micro-location.
In My World
I don’t have any new active listings to announce publicly right now, but I did just bring an off-market home in Mill Valley into escrow for one of my seller clients. This is a good example of why, in certain situations, off-market exposure can be the best path—especially when privacy, timing, or control of the process is a priority.
Through my participation in Top Agent Network, I can quietly market a home to a highly vetted group of top-performing agents and qualified buyers across Marin, San Francisco, and the greater Bay Area. In the right circumstances, this approach can produce a strong result without the uncertainty or disruption of a full public launch.
Looking ahead, it’s never too soon to start planning for the spring market. The homes that perform best in March, April, and May are typically the ones where strategy begins months in advance—deciding whether to go on-market or off-market, identifying the highest-impact improvements, and aligning timing with broader market conditions.
My Continued Gratitude
As Thanksgiving gives way to the rest of the holiday season, I want to express sincere gratitude to my clients and community for your trust and support. I’m grateful for the opportunity to guide people through meaningful real estate decisions, and I never take that confidence for granted.
How Can I Help?
Marin County continues to offer a compelling combination of lifestyle, location, and value. I am always happy to talk about the Marin County real estate market. Call or text me at 415-847-5584 for a personalized report for your home and neighborhood, or to discuss the best strategy for making your real estate goals a reality.
Now Available!

Exclusively Offered for $4,895,000
Swipe to See More Homes


Check Out My Sizzle Reel!
From the Golden Gate Sotheby’s Bay Area Market Report…
SEASONAL SOFTNESS BUT STRONG VENTURE AND WAGE GROWTH
Cooler temperatures marked the start of the winter buying season in the SF Bay Area. While activity generally softens from the summer peak, conditions were somewhat bifurcated by county this November. Overall, the state of the SF Bay Area economy was clouded by the federal government shutdown, but some indicators were positive. More than $140 billion in venture capital funding was deployed in the SF Bay Area , nearly 60% of all VC funding nationally, with the majority focused on artificial intelligence. Through November, SF Bay Area venture capital funding was up by more than 40% compared with the entirety of last year. Strong VC funding and wage growth across a range of industries supported increased economic activity across the region. At the same time, the continued return to office bolstered buyer demand for homes in the inner Bay Area.
INVENTORY RISES ACROSS MOST BAY AREA COUNTIES
More homes were available than last year across much of the SF Bay Area. There were nearly 5,500 homes on the market in November, an 11% increase from last year. The largest increases in inventory were in Contra Costa and Napa counties. Despite the increase in inventory, available options remained relatively limited in most counties relative to historical averages. San Francisco was a notable outlier as the only county with fewer homes available than last year.
SALES VOLUME VARIES REGIONALLY
The number of closed sales decreased slightly from last year, but there was significant bifurcation by geography and price point. At the regional level, more than 3,000 homes sold in November, approximately 200 fewer than last year. The largest decline in sales was in Santa Clara County, where sales fell by 18%. The slower sales velocity was consistent among price segments and reflects the tightness of available inventory. Conversely, the number of sales increased significantly in the North Bay. Sales activity in Marin and Napa counties was boosted by an increase in the less than $1.25 million price range. Buyers of these homes are generally more sensitive to changes in mortgage rates, which decreased in recent months. Closed sales in San Mateo County also increased by 5%, with a greater number of sales in nearly every price segment. The largest increases in sales in the greater than $3.5 million price category were in Contra Costa, San Francisco and San Mateo counties.
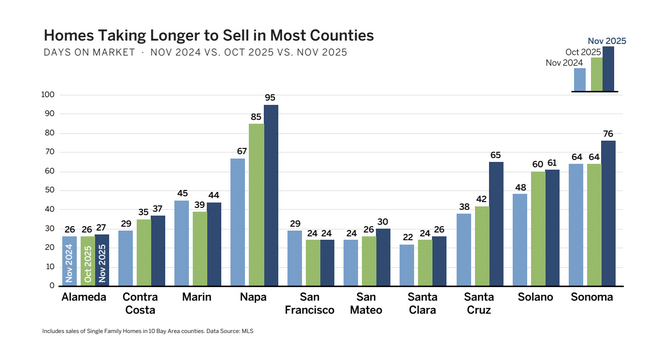
TIME ON MARKET DEPENDENT ON LOCATION AND PRICING
Well-located and well-priced homes continued to sell quickly and for more than the list price in many neighborhoods. The average number of days homes spent on the market increased by more than a week to nearly six weeks, which was slightly more than the historical average. This increase reflected homes staying on the market much longer than last year in Napa, Solano, and Sonoma counties. Roughly 45% of all sales, a slight decrease from last year, were greater than the list price, highlighting the broader shift toward equilibrium between supply and demand. However, buyer demand remained strong in the inner SF Bay Area as homes sold in one month or less on average and more than half of homes sold for more than the listing price. Notably, the tight market in San Francisco and strong demand resulted in homes selling in three weeks on average and more than 80% of homes sold for over asking. Homes that sold over asking in San Francisco in November also closed for 21% more than the list price on average, nearly double the regional rate.
SALES PRICE GROWTH MIXED
Price growth was also bifurcated across the SF Bay Area in November. The median sales price in the region decreased by 1% year-over-year. However, the median price increased by 15% in San Francisco County and by 3% in Napa County. Prices were relatively stable in Contra Costa, Santa Clara, Santa Cruz and Sonoma counties. Meanwhile, prices declined by more than 5% in Alameda, Marin and San Mateo counties. This drop in pricing was influenced by a larger share of lower-priced homes closing in November rather than a widespread drop in home values.
LOOKING AHEAD
While buyer demand remained greater than available supply in most neighborhoods and price points, the regional housing market continued to move towards equilibrium. The potential for conventional mortgage rates to decrease in the coming months could bring additional buyers off of the sidelines. Along with continued income gains, lower mortgage rates would increase housing affordability and further strengthen demand for SF Bay Area housing. In the near term, buying activity should slow into December as is typical in most years. As the calendar turns to 2026, the potential combination of lower mortgage rates, income gains, stock market and IPO strength could lead to an increase in potential homebuyers
What My Clients Are Saying…
Marin Real Estate Market Stats


Marin County Real Estate Market Report Charts
(click any slide to enlarge & launch slideshow)
“For Sale” vs. Sold Home Prices vs. Median Home Prices

Marin Home Prices List Price vs. Sold

Marin County Months of Inventory Based on Closed Sales

Average Price Per Square Foot

Marin County Number of Homes on the Market

I hope you have found my Marin County Real Estate Market Report informative. Please feel free to add your comments, questions or suggestions in the comments section below. If I may be of any assistance in helping you attain your real estate goals, please call or text me at 415-847-5584 and I will be in touch right away.
Would you like to see this data for your town only?
I am also excited to announce that my website now has new real estate market reports by town with more coming soon. Please check these out:
Belvedere Real Estate Market Report
Corte Madera Real Estate Market Report
Fairfax Real Estate Market Report
Kentfield Real Estate Market Report
Larkspur Real Estate Market Report
Mill Valley Real Estate Market Report
Novato Real Estate Market Report
San Anselmo Real Estate Market Report
San Rafael Real Estate Market Report
Tiburon Real Estate Market Report
These are all accessible from the “Market Reports” menu item here on my website at any time.

About the Author
Thomas Henthorne is consistently top-ranked, award-winning real estate agent in Marin, helping people buy and sell homes for almost a decade. He writes the #1 real estate blog in Marin County and is a frequent speaker on panels at industry gatherings.
He may be reached at 415-847-5584.


Leave a Comment
What do you think?Please leave your comment below!